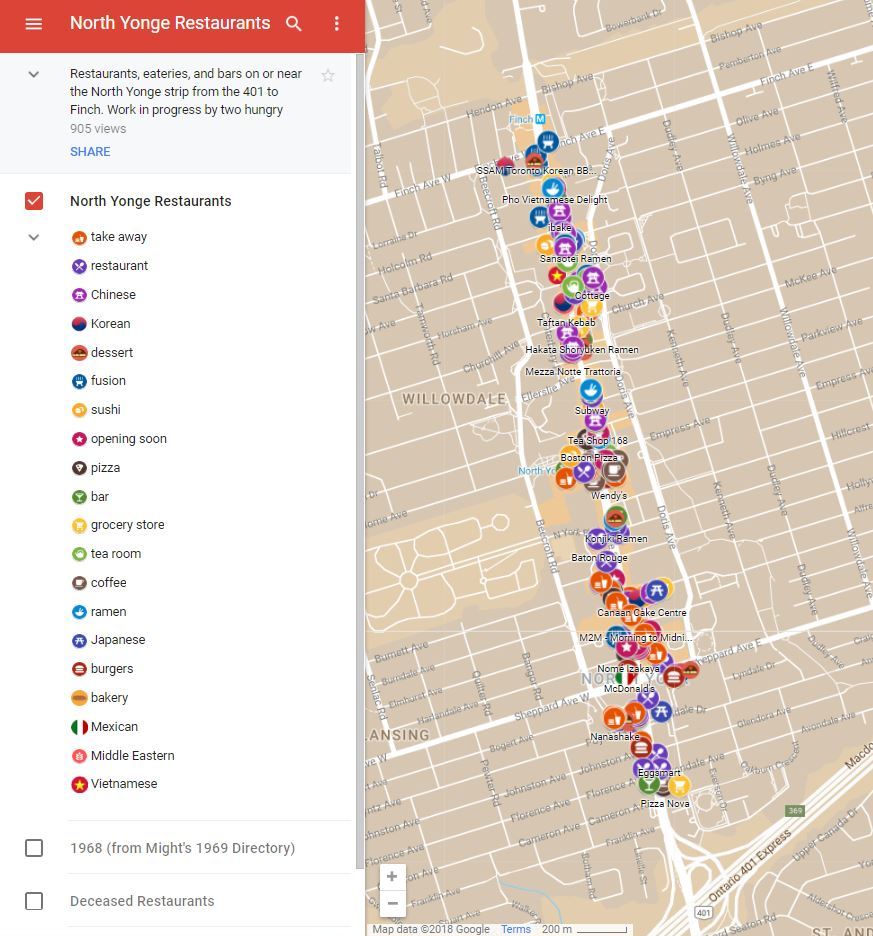
Where do you want to eat? My friend Giles Orr and I have made a Google Map showing all the restaurants, eateries, and bars on or near the north Yonge Street strip between Highway 401 and Finch Avenue in North York (Toronto). Why? It began as a practical project to explore what culinary treasures there …